With a new mask policy being announced, it is clear that Clemson’s administration is seeing a significant decrease in COVID-19 cases. As such, it is important to keep an eye on these case numbers and trends throughout the 2021-2022 school year.
The Tiger has been tracking COVID-19 data at Clemson since the return to campus in August of 2020 in order to keep the campus community up to date. The following graphs have been selected to display current COVID-19 cases at Clemson as well as help the Clemson family understand the state of the pandemic on campus.
While interpreting these graphs, it is important to know that the university requires those recovering from COVID-19 cases to wait 90 days after testing positive to take another COVID test. As such, these students are not included in testing numbers.
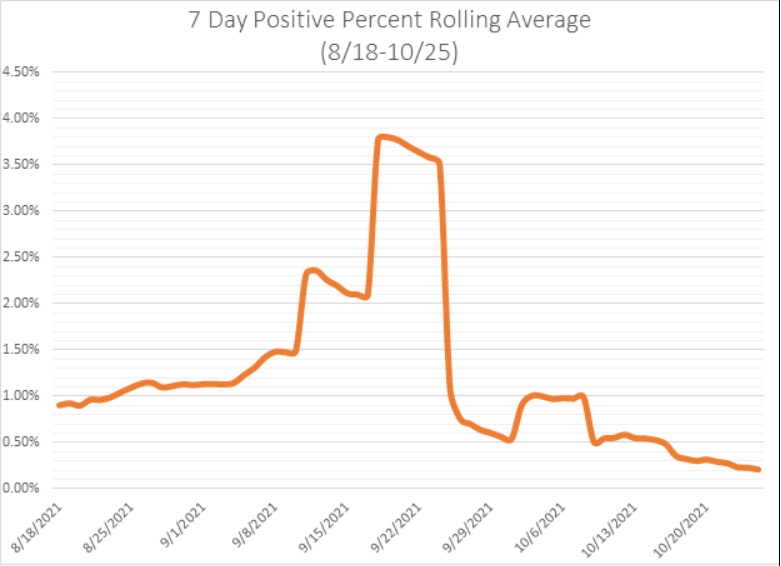
The first graph shows the average positive test percentage for the past 7 days and is measured daily. After a spike in mid-to-late September, the 7-day average has steadily decreased.
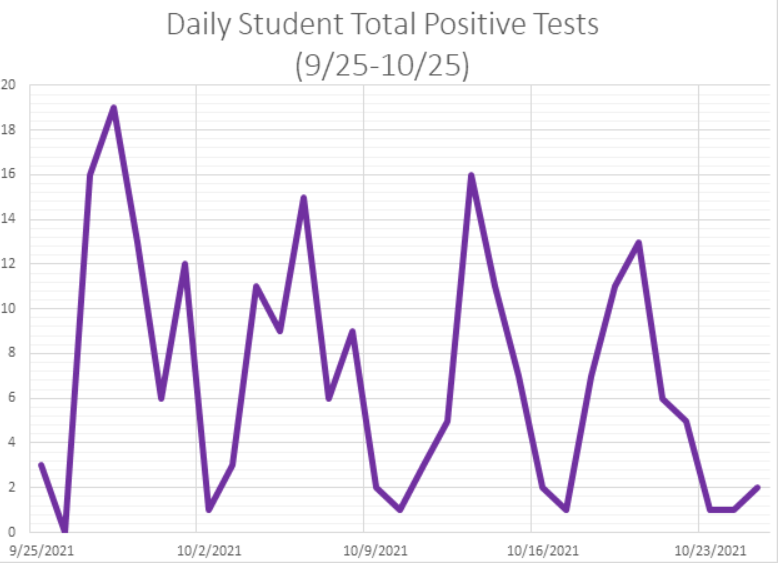
The daily student positive tests graph (second), taken from Sept. 25 to Oct. 25, shows a day by day analysis of positive COVID tests from students.
The daily positive test percentage graph (third) displays the percent of tests administered on campus that return positive, from Sept. 25 to Oct. 25. This statistic fluctuates less than the daily positive test totals. The percentage of tests returning as positive is on a decline currently and is at under 0.25%.
While these statistics show COVID-19 on campus is on the decline, Clemson is not in the clear yet.
Analysis: The recent decline in COVID cases
Jason Van Meir, Contributor
November 4, 2021
Jason Van Meir, Contributor
Daily Student Positive Tests
0
Donate to The Tiger
Your donation will support the student journalists of Clemson University. Your contribution will allow us to purchase equipment and cover our annual website hosting costs.
More to Discover


